One of the perks of working for the new company is the usage of cool tools and providers. One of the new providers is Akamai – state of the art CDN/EdgeCache provider – and also the first one to exist.
The cool new tool: Kibana4!
Just a quick introduction to Kibana: Kibana belongs to the ELK Stack (Elasticsearch, Logstash and Kibana) – and as you spotted correctly comes in last, as it forms the Web/Userinterface to the underlying Elasticsearch database. Logstash sits somewhere in between and is a powerful tool to parse many log formats and also to inject them into Elasticsearch. Elasticsearch itself holds the data and offers a search engine/index.
Why do you need ELK? In a multi-server environment you will want to have your logs somewhere centralized – that is so you do not need to log into each box. Also you want to maybe have some kind of webinterface so you do simple tasks without some commandline-fu – like filtering all failed cronjobs.
There are some great tools that can achieve this as well, like syslog-ng or Graylog.
This recipe will take care of three major points:
- Actual grok filter to match the logs
- Fix @timestamp to be parsed directly from log-line (as the logs come in batches and often also not in chronological order)
- Apply GeoIP (via maxmind) filter to ClientIP so we can create cool looking maps on our dashboard
First things first
Currently there are two options to receive Logs from Akamai, via FTP and via email. You will want to receive it via FTP so I would suggest to setup a ftp server on your ELK setup.
Akamai will either send the log file gzipped or GPGP encrypted, both formats that Logstash can not read in-house, so you will need to build a script to translate it into plain/text.
Be smarter than me and chose a ftp-daemon that supports uploadscripts, like pure-ftpd or proftpd. It is much easier than using vsftpd + some funky logfile-analyzer-upload-script.
Setup Akamai Log Delivery Service (LDS)
- Log into your Luna Control Center
- Configure > Log Delivery
- Select your Object > “Begin Delivery”
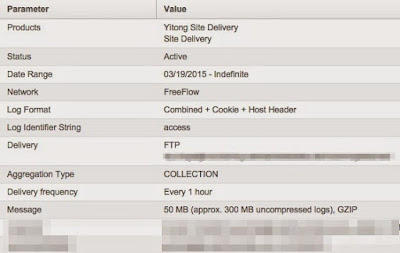
- Make sure you choose “Combined + Cookie + Host Header” as log format – this will give us the possibility to extinguish between different projects later on Kibana
My settings look approx. like this:
Use the following Logstash configuration
$ sudo nano /etc/logstash/conf.d/11-akamai-access.conf
input {
  file {
    path => "/home/logs/incoming/akamai/access_*"
    exclude => "*.gz"
    type => "akamai-access"
  }
}

filter {
  if [type] == "akamai-access" {
    grok {
      match => { "message" => "%{IP:clientip} - - [%{HTTPDATE:timestamp}] %{HOSTNAME:hostname} "%{WORD:verb} /%{HOSTNAME:origin}%{URIPATHPARAM:request} HTTP/%{NUMBER:httpversion}" %{NUMBER:response:int} %{NUMBER:bytes:int} "(?:%{URI:referrer}|-)" %{QS:agent} %{QS:cookie}" }
    }

    date {
      match => [ "timestamp", "dd/MMM/yyyy:HH:mm:ss Z"]
    }
  }

  if [clientip] {
    geoip {
      source => "clientip"
      target => "geoip"
      add_field => [ "[geoip][coordinates]", "%{[geoip][longitude]}" ]
      add_field => [ "[geoip][coordinates]", "%{[geoip][latitude]}"  ]
    }
    mutate {
      convert => [ "[geoip][coordinates]", "float" ]
    }
  }
}
Thats it!
- Restart/reload logstash
- Wait a few for the log files to come in (might take some hours)
- Explore the data and create some nice visuals!
Some final notes: there are some major advantages (well and also disadvantages) when analyzing logs directly from the CDN/EdgeCache:
- You will get the actual Client-IP (you might be able to redirect it through your ELB until down to your EC2 – but that might be hell of a job)
- You will get more accurate Data, as in the best scenario your actual webserver will only get hit once a day 😉
One of the disadvantages: you do not (though there might be products for that) get the data in real time.